Why a Risk Matrix Matters in 2026
Global chemical sourcing now faces a spectrum of shocks: the Hormuz crisis, Section 301 tariffs, EU anti‑dumping actions, and divergent PFAS rules. These events expose supply chains to heightened volatility. A well‑structured chemical procurement risk matrix turns complex uncertainties into actionable insights, helping procurement leaders prioritize mitigation and align strategy with board expectations.
Core Dimensions of the Matrix
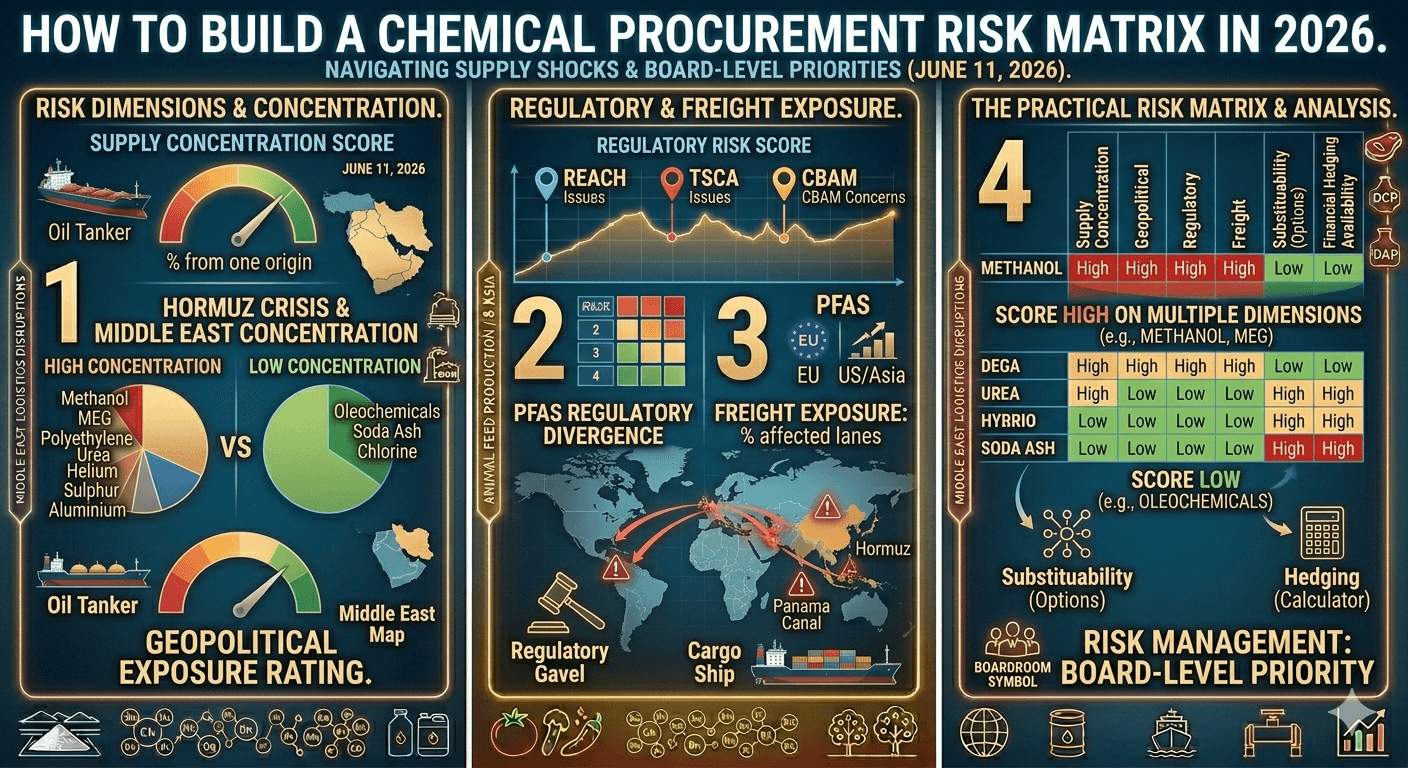
1. Supply Concentration Score
Measure the % of a chemical sourced from a single geographic origin. High concentration (>70%) signals single‑point risk and should trigger diversification.
2. Geopolitical Exposure Rating
Rate each supplier’s country on political stability, sanctions risk, and trade disputes. Use a 1–5 scale, with 5 indicating high exposure.
3. Regulatory Risk Score
Track active REACH, TSCA, CBAM, or other regional regulations. Assign a weight based on the potential compliance cost and timeline.
4. Freight Exposure %
Calculate the proportion of freight that travels through high‑risk lanes (e.g., Strait of Hormuz, Suez Canal). This reflects shipping delays or price spikes.
5. Substitutability Score
Assess how easily a chemical can be replaced. Low substitutability (<30%) increases strategic risk.
6. Financial Hedging Availability
Determine if forward contracts, options, or swaps can lock in price. Lack of hedging tools magnifies price volatility.
Constructing the Matrix
Step 1: Data Collection
Gather data from supplier audits, market intelligence, and internal ERP systems. Leverage APIs from trade data providers to keep geopolitical scores current.
Step 2: Weight Assignment
Assign relative importance to each dimension based on industry priorities. Example: Supply Concentration 25%, Geopolitical 20%, Regulatory 20%, Freight 10%, Substitutability 15%, Hedging 10%.
Step 3: Scoring and Aggregation
Score each chemical on every dimension, multiply by its weight, and sum to get a total risk score (0–100). Higher scores indicate higher risk.
Step 4: Visual Representation
Use a heat‑map style grid or a radar chart. Color‑code: Red (80–100) = High, Orange (50–79) = Medium, Green (<50) = Low.
Case Examples for 2026
- Methanol – 85% sourced from the Middle East, high geopolitical exposure, limited substitutes, and no robust hedging. Score: 92
- MEG (Methyl Ethyl Glycol) – 70% from Saudi Arabia, moderate regulatory risk, but good freight routes. Score: 78
- Polyethylene – 60% from Gulf, high regulatory scrutiny under EU anti‑dumping. Score: 81
- Urea – 55% from Qatar, moderate substitutability via local fertiliser. Score: 68
- Helium – 80% from Middle East, critical for high‑tech sectors, no substitutes. Score: 95
- Aluminium – 65% from Gulf, but significant domestic production in the US. Score: 70
- Oleochemicals – multi‑origin from palm and coconut plantations, low concentration, low regulatory risk. Score: 35
- Soda Ash – US trona‑based, low geopolitical risk, high substitutability. Score: 28
- Chlorine – locally produced in many regions, low concentration. Score: 30
Strategic Actions Based on Matrix Insights
1. Diversify Supplier Base
For chemicals scoring >80, identify alternative suppliers in lower‑risk regions or develop dual‑source contracts.
2. Strengthen Regulatory Compliance
Allocate R&D to reformulate products or obtain approvals for substitutes to reduce regulatory risk scores.
3. Optimize Freight Routes
Negotiate vessel contracts that bypass high‑risk lanes or invest in near‑shoring to cut freight exposure.
4. Expand Hedging Instruments
Partner with financial institutions to create bespoke commodity swaps for high‑price‑volatile chemicals.
5. Build Substitution Libraries
Maintain a catalog of low‑substitutability chemicals and their potential replacements to quickly adjust sourcing strategies.
Integrating the Matrix into Procurement Planning
Embed the risk matrix within your industrial procurement planning cycle. Use it to:
- Prioritize vendor risk assessments.
- Inform capital budgeting for new facilities or storage.
- Guide strategic negotiations with suppliers.
- Align risk appetite with board‑level objectives.
Conclusion
A dynamic, data‑driven chemical procurement risk matrix is no longer optional—it is essential. By quantifying exposure across supply concentration, geopolitical, regulatory, freight, substitutability, and hedging dimensions, procurement leaders can proactively manage chemical sourcing strategy, enhance supply chain resilience, and meet the demands of an unpredictable 2026 market.
Borax Pentahydrate - Argentina